On October 8, 2026 at 09:00 UTC, a magnitude 6.3 earthquake struck 102 km NE of Norsup, Vanuatu. The USGS PAGER system assigned a green alert level for this event, signalling no significant casualties or damage expected. It is the largest earthquake currently listed for worldwide over the past 7 days. See the M6.3 event page for the full report, ShakeMap, and citizen-reported intensity data.
Live Earthquake Tracker
Real-time earthquake data from the U.S. Geological Survey, refreshed every five minutes. Track worldwide seismic activity, explore recent events, and understand what the data means.
Worldwide Earthquakes — Last 24 Hours
M2.5+ • 27 events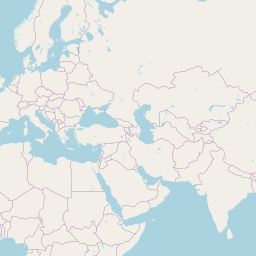
Circle size scales with magnitude; color encodes magnitude band from yellow (M2.5–3.9) through orange (M4–4.9) and red (M5–5.9) to dark red (M6+); M4.0+ events display the magnitude number. Depth is shown on the individual event page. Events below magnitude 2.5 are omitted for map legibility.
Recent Earthquakes
Updated just now4.6
Izu Islands, Japan region
1 hour ago
3.2
72 km SE of Chignik, Alaska
2 hours ago
4.8
46 km N of Waingapu, Indonesia
2 hours ago
4.7
84 km WNW of Bengkulu, Indonesia
5 hours ago
4.9
113 km NW of Baa, Indonesia
6 hours ago
3.5
119 km SW of Nikolski, Alaska
7 hours ago
5.1
236 km E of Levuka, Fiji
10 hours ago
6.3
102 km NE of Norsup, Vanuatu
11 hours ago
2.7
50 km W of Nanwalek, Alaska
11 hours ago
2.7
2 km WNW of Fontana, CA
12 hours ago
5.5
17 km SW of Burias, Philippines
12 hours ago
4.6
61 km W of Banda Aceh, Indonesia
12 hours ago
Global activity this week
Aggregate analysis of the past 7 days, followed by narrative reports on the week's significant events.
Over the past seven days the tracker has recorded 302 earthquakes of magnitude 2.5 or greater. Most are small: earthquakes grow logarithmically more frequent as magnitude drops (the Gutenberg–Richter law), and the largest events cluster along the Pacific, Indian, and Southern Ocean subduction zones and the mid-ocean ridges — which is why most epicenters fall offshore. Shallow crustal earthquakes produce the strongest surface shaking per unit magnitude, so a shallow M6 near a city can be felt by millions while a deep M7 under the ocean may barely register.
31 M5.0+140 M4.0–4.9222 shallow12 deep-focus131 offshore2,373 felt reports
The week's most consequential events
Flagged by the USGS as significant based on magnitude, population exposure, peak shaking intensity, and felt-report volume. Ordered from largest magnitude to smallest.
A magnitude 5.9 earthquake was recorded 39 km WSW of Tambolaka, Indonesia on October 3, 2026 at 22:55 UTC. The USGS PAGER system assigned a green alert level for this event, signalling no significant casualties or damage expected. See the M5.9 event page for the full report, ShakeMap, and citizen-reported intensity data.
Seismographs logged a magnitude 5.8 earthquake 165 km SSE of Vilyuchinsk, Russia with origin time 16:34 UTC on October 2, 2026. The USGS PAGER system assigned a green alert level for this event, signalling no significant casualties or damage expected. See the M5.8 event page for the full report, ShakeMap, and citizen-reported intensity data.
On October 6, 2026, worldwide registered a magnitude 5.8 earthquake 262 km SSW of Severo-Kuril’sk, Russia at 16:48 UTC. The USGS PAGER system assigned a green alert level for this event, signalling no significant casualties or damage expected. See the M5.8 event page for the full report, ShakeMap, and citizen-reported intensity data.
At 08:07 UTC on October 8, 2026, a magnitude 5.5 tremor occurred 17 km SW of Burias, Philippines. The USGS PAGER system assigned a green alert level for this event, signalling no significant casualties or damage expected. The event was offshore. See the M5.5 event page for the full report, ShakeMap, and citizen-reported intensity data.
The USGS recorded this magnitude 5.5 earthquake west of Macquarie Island at 06:46 UTC on October 8, 2026. The USGS PAGER system assigned a green alert level for this event, signalling no significant casualties or damage expected. See the M5.5 event page for the full report, ShakeMap, and citizen-reported intensity data.
This magnitude 5.5 event was detected 92 km NNW of Aleneva, Alaska on October 6, 2026, with origin time 18:34 UTC. The USGS PAGER system assigned a green alert level for this event, signalling no significant casualties or damage expected. See the M5.5 event page for the full report, ShakeMap, and citizen-reported intensity data.
Reports of a magnitude 5.3 earthquake near central Mid-Atlantic Ridge came in on October 5, 2026 at 01:18 UTC. See the M5.3 event page for the full report, ShakeMap, and citizen-reported intensity data.
A magnitude 5.3 seismic event took place 81 km SSW of Banda Aceh, Indonesia on October 3, 2026 at 23:37 UTC. The USGS PAGER system assigned a green alert level for this event, signalling no significant casualties or damage expected. See the M5.3 event page for the full report, ShakeMap, and citizen-reported intensity data.
October 7, 2026 brought a magnitude 5.2 earthquake in the Chagos Archipelago region, logged at 14:59 UTC. See the M5.2 event page for the full report, ShakeMap, and citizen-reported intensity data.
On October 2, 2026 at 04:44 UTC, a magnitude 5.1 earthquake struck 159 km SE of Gizo, Solomon Islands. The event was offshore. See the M5.1 event page for the full report, ShakeMap, and citizen-reported intensity data.
A magnitude 5.1 earthquake was recorded 236 km E of Levuka, Fiji on October 8, 2026 at 10:07 UTC. This is the deepest earthquake in the current dataset — a deep-focus event. See the M5.1 event page for the full report, ShakeMap, and citizen-reported intensity data.
How earthquake data is measured
The three numbers you see next to every event on this site — magnitude, depth, and shaking intensity — each capture a different physical quantity. Knowing what each one is (and is not) makes the difference between reading the map and understanding what the map is telling you.
Magnitude: the energy at the source
Magnitude quantifies the total energy released by the earthquake at the fault rupture, as a single number. Modern magnitudes above roughly M4 are reported on the moment magnitude scale (Mw or Mww), which is calibrated against fault-area and slip measurements rather than simple amplitude readings. Because the scale is logarithmic, each whole-number step represents a thirty-two-fold increase in energy release: an M6 releases about 32 times more energy than an M5, and 1,000 times more than an M4. The seemingly small gap between M5.5 and M6.5 is the difference between a window-rattling local quake and a regional disaster. Our article on how modern magnitude is calculated walks through why older scales (Richter, mb, ML) were replaced for larger events.
Depth: where the rupture started
Every earthquake has both an epicenter (the point on the surface directly above the rupture) and a hypocenter (the 3D point in the crust or mantle where the rupture nucleated). Depth is the vertical coordinate of the hypocenter, reported in kilometers. The USGS groups depths into three bands: shallow (less than 70 km), intermediate (70–300 km), and deep-focus (greater than 300 km). Shallow events are by far the most numerous and are responsible for nearly all earthquake damage on land, because their seismic waves have less rock to attenuate on the way to the surface. Deep-focus events, some as deep as 700 km, almost always occur inside descending subduction slabs and rarely cause strong surface shaking. More on the distinction between shallow and deep-focus earthquakes.
Intensity: what the ground actually did
Where magnitude is one number per earthquake, intensity is a map — a different value for every location where the shaking was recorded or reported. The USGS uses the Modified Mercalli scale (MMI) I through X+, with descriptive anchors like "weak", "moderate", "strong", and "severe". MMI is derived from peak ground acceleration, peak ground velocity, and crowd-sourced felt reports submitted to the Did You Feel It? system. A headline number like "M7.1" describes the source; a ShakeMap showing MMI VIII in one neighborhood and MMI IV a few kilometers away describes how the crust, soil, and distance from the rupture shaped what people actually felt. When reviewing an event, always look at both — magnitude tells you how big it was, intensity tells you how it landed.
Where earthquakes happen, and why
The global map of earthquake epicenters is not random. Plot ten thousand events and the outlines of Earth's tectonic plates emerge — virtually all seismicity is concentrated along the boundaries where plates converge, diverge, or slide past one another. Understanding plate boundary stress accumulation is the single most useful frame for reading our maps.
The Pacific Ring of Fire
About 80% of the world's largest earthquakes, and nearly all of the world's deep-focus events, originate along the 40,000-kilometer loop of subduction zones ringing the Pacific. This includes the coasts of Japan, Indonesia, the Philippines, Alaska, Chile, Peru, and New Zealand. These zones produce both frequent shallow thrust earthquakes at the subduction interface and sparse but very large intermediate-depth events inside the downgoing slab.
The Alpine–Himalayan belt
Running from the Mediterranean through Türkiye, the Caucasus, Iran, and into the Himalayas and Myanmar, this continental-collision belt is responsible for roughly 15% of global seismicity. The February 2023 Türkiye–Syria sequence and the historical Himalayan megathrusts beneath Nepal and northern India are the canonical examples. Because these earthquakes occur within continental crust where millions of people live, their impact per unit magnitude is often disproportionate.
Mid-ocean ridges, transform faults, and intraplate zones
The global mid-ocean ridge system — a 65,000 km submarine mountain range where plates diverge — produces a steady stream of small-to-moderate earthquakes, almost all offshore and rarely felt. Transform boundaries like California's San Andreas Fault or New Zealand's Alpine Fault generate large strike-slip events that can reach magnitude 8 but typically do not trigger tsunamis. Finally, a small but consequential fraction of earthquakes occur far from any active plate boundary — intraplate events like the 1811–12 New Madrid sequence or Australia's 2016 Petermann earthquake. These are poorly understood, rare, and often catch populations that have not prepared for seismic risk.
Earthquakes by U.S. state
Thirty-nine of the fifty U.S. states have experienced an earthquake strong enough to damage structures in historical time, but seismic risk is far from evenly distributed. Alaska is the most seismically active state in the country by a large margin, logging more earthquakes than the other forty-nine combined — a direct consequence of the Aleutian subduction zone running along its southern coast. California comes next, dominated by the San Andreas transform system and its many branches. Other states with significant recurring risk include Washington and Oregon (Cascadia subduction zone), Hawaii (volcanic and flank-collapse events), and a scatter of intraplate zones from Oklahoma (injection-induced seismicity since 2009) to the New Madrid zone stretching across Missouri, Arkansas, and Tennessee. Select any state below for its live 30-day seismic activity, fault-system context, and historical risk profile.
CaliforniaAlaskaWashingtonOregonOklahomaTennesseeUtahNevadaHawaiiTexasMissouriMontanaIdahoSouth CarolinaNew YorkNew JerseyArizonaColoradoArkansasKentuckyIllinoisVirginiaOhioGeorgiaNorth CarolinaNorth DakotaConnecticutAlabamaDelawareFloridaIndianaIowaKansasLouisianaMaineMarylandMassachusettsMichiganMinnesotaMississippiNebraskaNew HampshireNew MexicoPennsylvaniaRhode IslandSouth DakotaVermontWest VirginiaWisconsinWyoming
Earthquakes by city
City-level pages focus on the nearest active faults, local shaking history, and the specific population exposure that makes a moderate earthquake in a dense urban area qualitatively different from a large earthquake in a remote region. Dense-city monitoring is where earthquake preparedness matters most — the difference between a magnitude 6 in Los Angeles and a magnitude 6 offshore Alaska is measured in billions of dollars and thousands of lives.
Worldwide earthquake coverage
We maintain live pages for more than 100 earthquake-prone countries, grouped by tectonic setting. Subduction-zone countries like Japan, Indonesia, and Chile experience the planet's most energetic earthquakes, regularly producing magnitude 7 events and occasional magnitude 8+ megathrusts. Türkiye, Iran, and Italy sit along the Alpine–Himalayan belt, where continental collision produces shallower but frequently destructive events. Iceland offers a rare onshore window onto mid-ocean-ridge spreading. Pick a country to see its 30-day activity, tectonic context, and most recent significant events.
Browse all countriesFrequently asked questions
How many earthquakes happen every day worldwide?
Seismographic networks typically detect around 250 magnitude 2.5 or greater earthquakes every day globally — roughly one every six minutes — and about 55 of magnitude 4.5 or greater. In the last 24 hours this tracker has logged 158 events of magnitude 2.5 or greater, with 5 at magnitude 5.0 or higher. On longer timescales the USGS catalogs roughly one magnitude 7 earthquake per month and, on average, one magnitude 8 or greater per year. Smaller microquakes in the M0–2 range are an order of magnitude more numerous but are usually only detected by dense regional networks.
What magnitude of earthquake is considered "significant"?
The USGS "significant" classification is not purely a magnitude threshold. An event is flagged as significant when it scores highly on a combined index that weighs magnitude, population exposure (PAGER), maximum ShakeMap intensity, reported felt-reports from the Did You Feel It? system, and the presence of a tsunami warning. This is why an offshore M6.5 in an unpopulated area may not be flagged significant while an onshore M4.8 near a major city will be. The "Global activity this week" section on this page uses that USGS-significant feed rather than a flat magnitude cutoff.
How accurate are earthquake magnitudes right after an event?
The first automatic magnitude reported for a large earthquake is usually a rough body-wave estimate derived in seconds from the initial P-waves, S-waves, and surface waves. Over the next 15 to 30 minutes the USGS typically computes a W-phase moment tensor, and within a few hours a regional moment-tensor solution. Final moment magnitudes (Mww) can shift the initial reported number by 0.2–0.5 units in either direction for events above M6.5; smaller earthquakes tend to stabilize faster. This is why you sometimes see the magnitude change on news sites — the physics did not change, the seismological solution refined. Our tracker marks unrevised solutions as "Auto" and reviewed solutions as "Reviewed".
What is the difference between magnitude and intensity?
Magnitude measures the energy released at the source and is a single number per earthquake. Intensity measures how strongly the shaking was felt at a specific location and therefore varies across the map — a single earthquake has many intensity values, typically expressed on the Modified Mercalli scale (MMI I–X+). An M5 earthquake might produce MMI VI directly above the epicenter and MMI II a hundred kilometers away. When you read a headline like "magnitude 6.0 earthquake", that is source energy; when you read "felt as VI (Strong)", that is local shaking intensity.
Can earthquakes be predicted?
No — short-term prediction of the time, place, and magnitude of an individual earthquake is not currently possible, and the USGS and virtually every academic seismology group reject claims to the contrary. What is possible is operational earthquake forecasting: given a decade of local seismicity, fault geometry, and strain accumulation data, researchers can estimate the likelihood of an earthquake above a given magnitude over the next 30 years in a specific region. The 2023 USGS National Seismic Hazard Model is one such product.
Why do some earthquakes cause tsunamis and others do not?
Tsunami generation requires three conditions to co-occur: the earthquake must be large enough to displace a significant volume of water (generally magnitude 6.5 or greater, often 7.0+), it must rupture the seafloor (so offshore, with a shallow focal depth under roughly 70 km), and the fault motion must have a vertical component that lifts or drops the water column — subduction-zone thrust ruptures qualify, strike-slip ruptures like the San Andreas usually do not. A deep-focus earthquake below 300 km, even at magnitude 8, cannot generate a tsunami because the seafloor barely deforms. Read more about the conditions for tsunami generation.
How often is this page updated?
The USGS publishes new earthquake feed data roughly every minute. This tracker refreshes its snapshot every 5 minutes via a scheduled job, and the page itself uses incremental static regeneration on the same cadence, so the counts, map, and event lists you see are never more than about 5 minutes behind the underlying feed. The largest event in the last 24 hours shown on this page was detected on October 8; the current snapshot was built 08:20 PM UTC.
About this data
All earthquake data on this site originates from the U.S. Geological Survey Earthquake Hazards Program, specifically the FDSN event web service that powers the USGS real-time feed. The feed aggregates arrival-time picks and moment-tensor solutions from regional networks including the Advanced National Seismic System (ANSS), the Alaska Earthquake Center, the Hawaiian Volcano Observatory, the Pacific Tsunami Warning Center, the European-Mediterranean Seismological Centre, and dozens of national counterparts.
We pull that feed on a 5-minute cadence through a scheduled job and regenerate this page — along with every state, city, country, and event page — using incremental static regeneration on the same cadence. The earliest revision of a large earthquake's magnitude is typically an automatic solution from the first P-wave arrivals; within 15 to 30 minutes the USGS computes a W-phase moment tensor, and we mark events as "Reviewed" once a seismologist has signed off on the final solution. If you are new to how those measurements are produced, start with modern seismological networks.
We deliberately show every magnitude 2.5 or greater event by default rather than a higher threshold — the M2.5 cutoff is the level at which the global catalog is considered essentially complete in well-instrumented regions, and excluding smaller events would hide genuine aftershock sequences and foreshock swarms. Events below M2.5 are still available on individual state and country pages via the magnitude filter.
Snapshot last refreshed: October 8, 2026 at 8:20 PM UTC. Most recent M7+ event: M7.8 on August 14, 2026 near 66 km NNW of Ende, Indonesia.